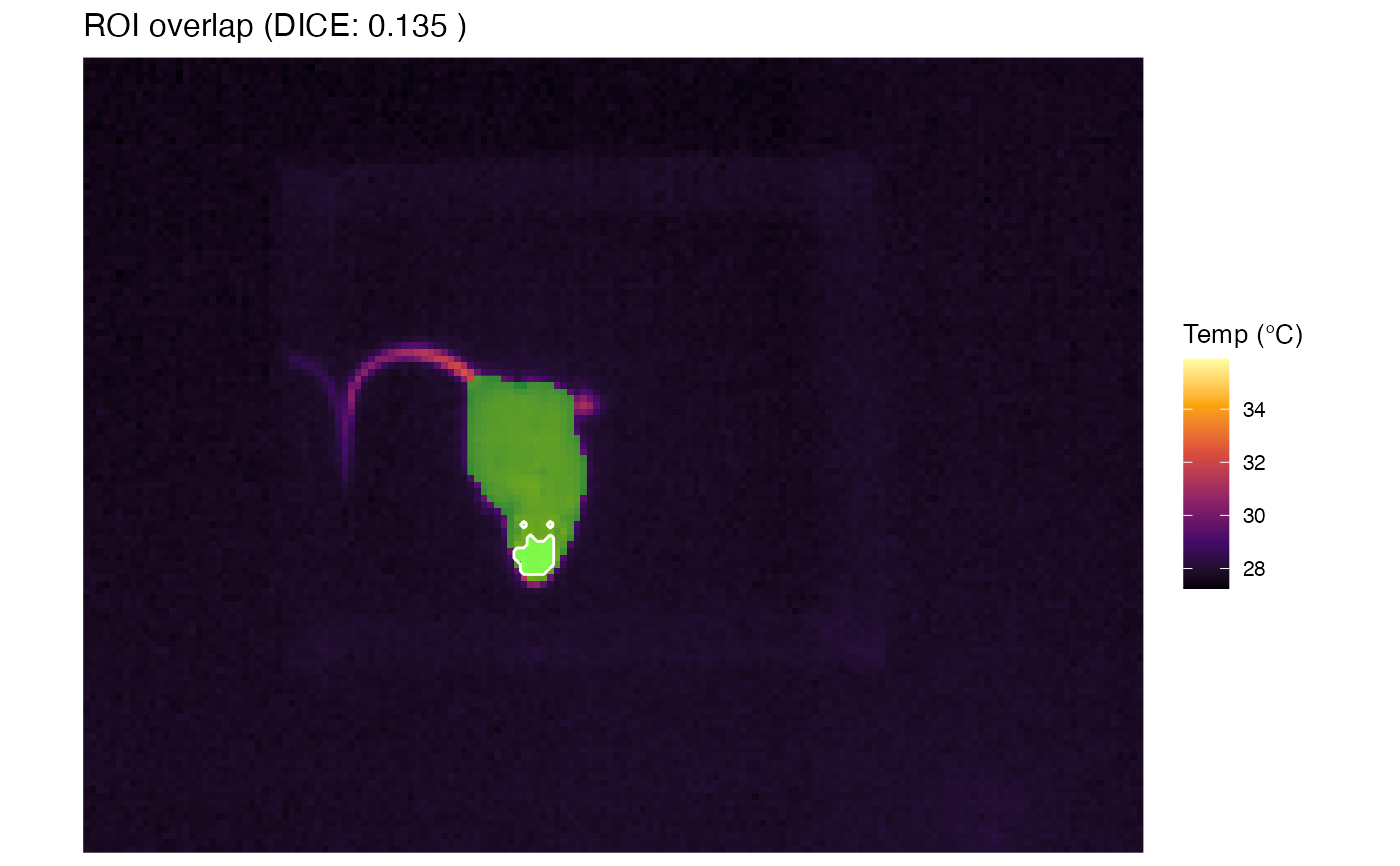
Visually compares two segmentation masks (ROIs) by overlaying them on the original thermal image. This function is primarily used for validation purposes: to compare an automated segmentation (filled layer) against a manual ground truth (contour line). It automatically calculates and displays the Dice Similarity Coefficient (DSC) in the title.
Usage
plot_roi_overlap(
  img_obj1,
  img_obj2,
  title = NULL,
  color = "green",
  alpha = 0.5,
  line_color = "white",
  palette = "inferno"
)
Arguments
- img_obj1
A 'BioThermR' object. Typically the Automated/Predicted segmentation. This object must contain the raw thermal matrix. Its mask will be plotted as a filled area.
- img_obj2
A 'BioThermR' object. Typically the Manual/Ground Truth segmentation. Its mask will be plotted as a contour outline. Dimensions must match
img_obj1.- title
String. Custom title for the plot. If
NULL(default), the title shows "ROI overlap (DICE: X.XXX)".- color
String. Fill color for the
img_obj1mask. Default is "green".- alpha
Numeric. Transparency level for the
img_obj1mask (0 to 1). Default is 0.5.- line_color
String. Line color for the
img_obj2contour. Default is "white".- palette
String. Color palette for the background thermal image (passed to
scale_fill_viridis_c). Default is "inferno".
Details
The visualization consists of three layers:
Background: The raw thermal image from
img_obj1.Prediction (img_obj1): The processed mask from the first object, rendered as a semi-transparent filled raster (default green).
Ground Truth (img_obj2): The processed mask from the second object, rendered as a contour outline (default white).
The function calculates the Dice Similarity Coefficient (DSC) using the formula: $$DSC = \frac{2 \times |X \cap Y|}{|X| + |Y|}$$ where X and Y are the set of pixels in the two masks. A DSC of 1 indicates perfect overlap.
Examples
# \donttest{
#' # Load raw data
img_obj <- system.file("extdata", "C05.raw", package = "BioThermR")
img <- read_thermal_raw(img_obj)
# Apply automated segmentation
img1 <- roi_segment_ebimage(img, keep_largest = TRUE)
#> Auto-Segmentation: Kept largest object ( 401 pixels )

# Simple background removal: Keep everything above 24 degrees
img2 <- roi_filter_threshold(img, threshold = c(33, Inf))
#> ROI Filter applied: Keeping range [33, Inf]

# Compare them
plot_roi_overlap(img_obj1 = img1,
                 img_obj2 = img2)

# }
# }