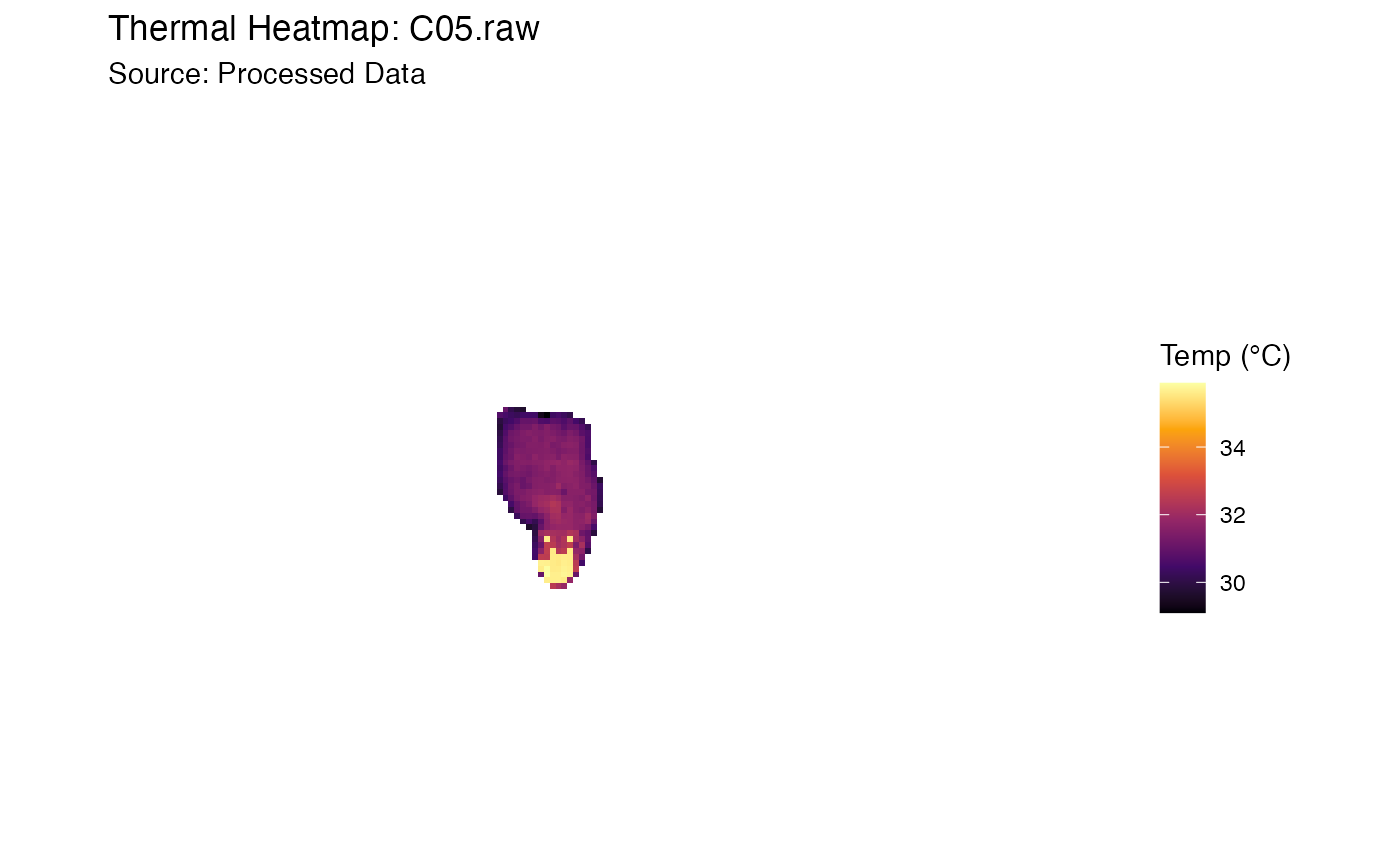
Generates a high-quality raster plot of the thermal data using the 'ggplot2' framework. This function allows for quick visualization of raw or processed matrices with customizable perceptually uniform color scales (viridis).
Arguments
- img_obj
A 'BioThermR' object.
- use_processed
Logical. If
TRUE(default), plots the 'processed' matrix (showing masking effects). IfFALSE, plots the original 'raw' data.- palette
String. The color map option from the 'viridis' package. Options include:
"magma","inferno","plasma","viridis","cividis". Default is"inferno".
Details
The function performs the following steps:
Converts the thermal matrix into a long-format data frame suitable for ggplot.
Renders the image using
geom_raster.Maps temperature to color using the specified 'viridis' palette.
Ensures the aspect ratio is preserved (
coord_fixed) so the image does not appear distorted.Sets
NAvalues (masked background) to transparent.
Since the output is a standard ggplot object, layers can be added subsequently (e.g., new titles or annotations).
Examples
# \donttest{
# Load raw data
img_obj <- system.file("extdata", "C05.raw", package = "BioThermR")
img <- read_thermal_raw(img_obj)

# Apply automated segmentation
img <- roi_segment_ebimage(img, keep_largest = TRUE)
#> Auto-Segmentation: Kept largest object ( 401 pixels )

# Standard plot
plot_thermal_heatmap(img)

# }
# }