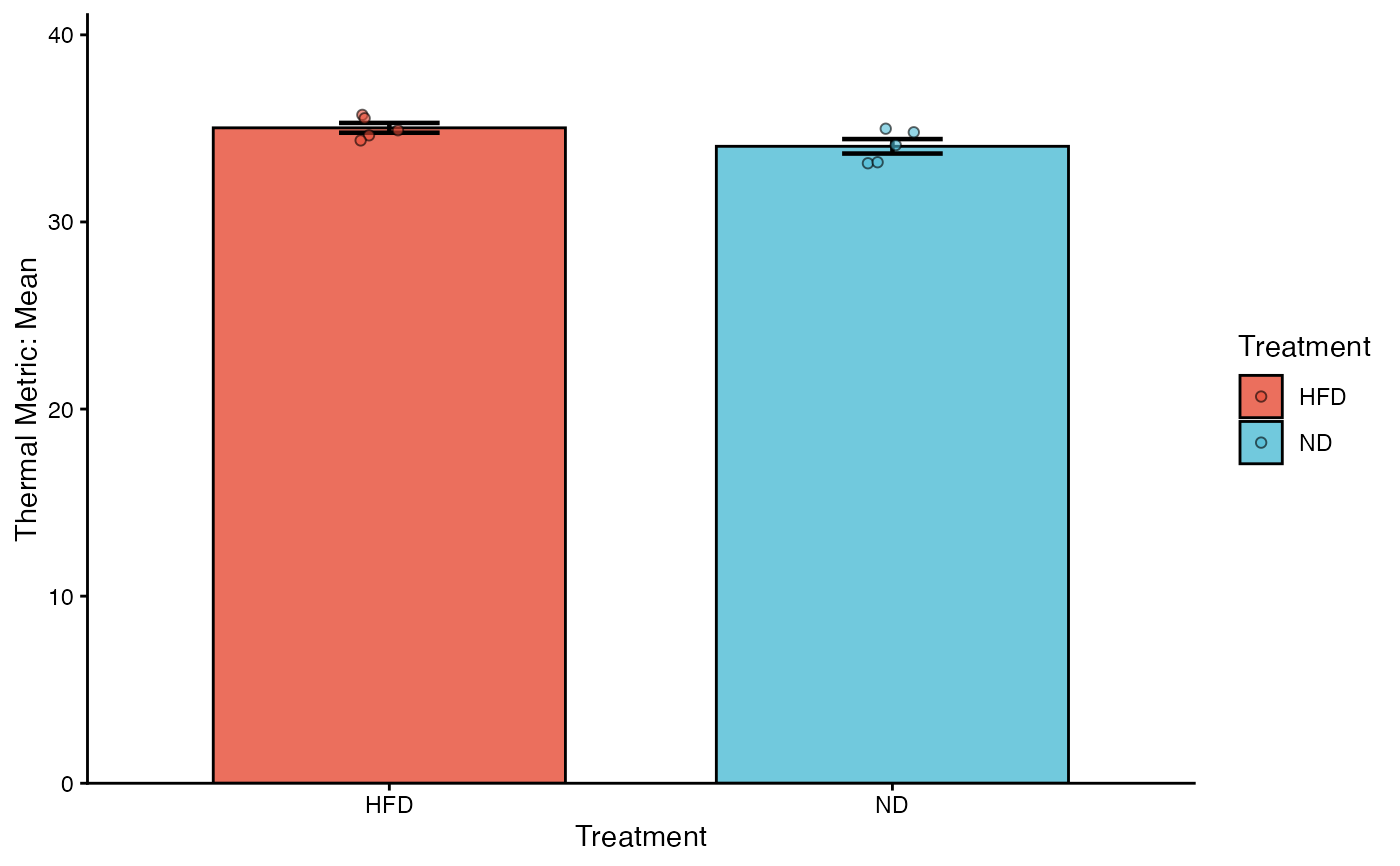
Creates a high-quality bar plot to compare thermal metrics across experimental groups. The visualization includes bars representing the mean, customizable error bars (SD or SE), and overlaid individual data points to show biological variation.
Usage
viz_thermal_barplot(
  data,
  y_var,
  x_var,
  fill_var = NULL,
  error_bar = "mean_sd",
  add_points = TRUE,
  point_size = 1.5,
  point_alpha = 0.6,
  palette = "npg"
)
Arguments
- data
Data frame. The merged dataset (e.g., output from
aggregate_replicates).- y_var
String. The name of the numeric column to plot (e.g., "Max_Temp", "Mean_Temp").
- x_var
String. The name of the categorical column for the X-axis groupings (e.g., "Treatment", "Genotype").
- fill_var
String. The name of the variable used for fill colors. Default is
NULL, which usesx_var.- error_bar
String. The type of error bar to display. Options:
"mean_sd": Mean +/- Standard Deviation (shows spread of data)."mean_se": Mean +/- Standard Error of the Mean (shows precision of the mean).
- add_points
Logical. If
TRUE(default), overlays individual data points usinggeom_jitter. This is highly recommended for small sample sizes (n < 20) to maintain transparency.- point_size
Numeric. The size of the individual jitter points. Default is 1.5.
- point_alpha
Numeric. The transparency of the jitter points (0 = transparent, 1 = opaque). Default is 0.6 to handle overlapping points.
- palette
String or Vector.
If a string: Pre-defined scientific palettes (
"npg"for Nature Publishing Group,"jco"for Journal of Clinical Oncology).If a character vector: A custom list of hex codes (e.g.,
c("#FF0000", "#0000FF")).
Details
This function is designed to produce figures that are immediately suitable for scientific manuscripts. Key features include:
Automatic Statistics: Calculates Mean and SD/SE internally using
stat_summary.Smart Coloring: Supports scientific palettes ("npg", "jco"). If the number of groups exceeds the palette size, it automatically interpolates to generate distinct colors.
Layout: Uses
theme_classic()and automatically expands the Y-axis limit by 15% to ensure error bars and significance annotations fit comfortably.