plot xpm data using ggplot2
Examples
# \donttest{
library(xvm)
xpm_file_path <- system.file("extdata/gibbs.xpm", package = "xvm")
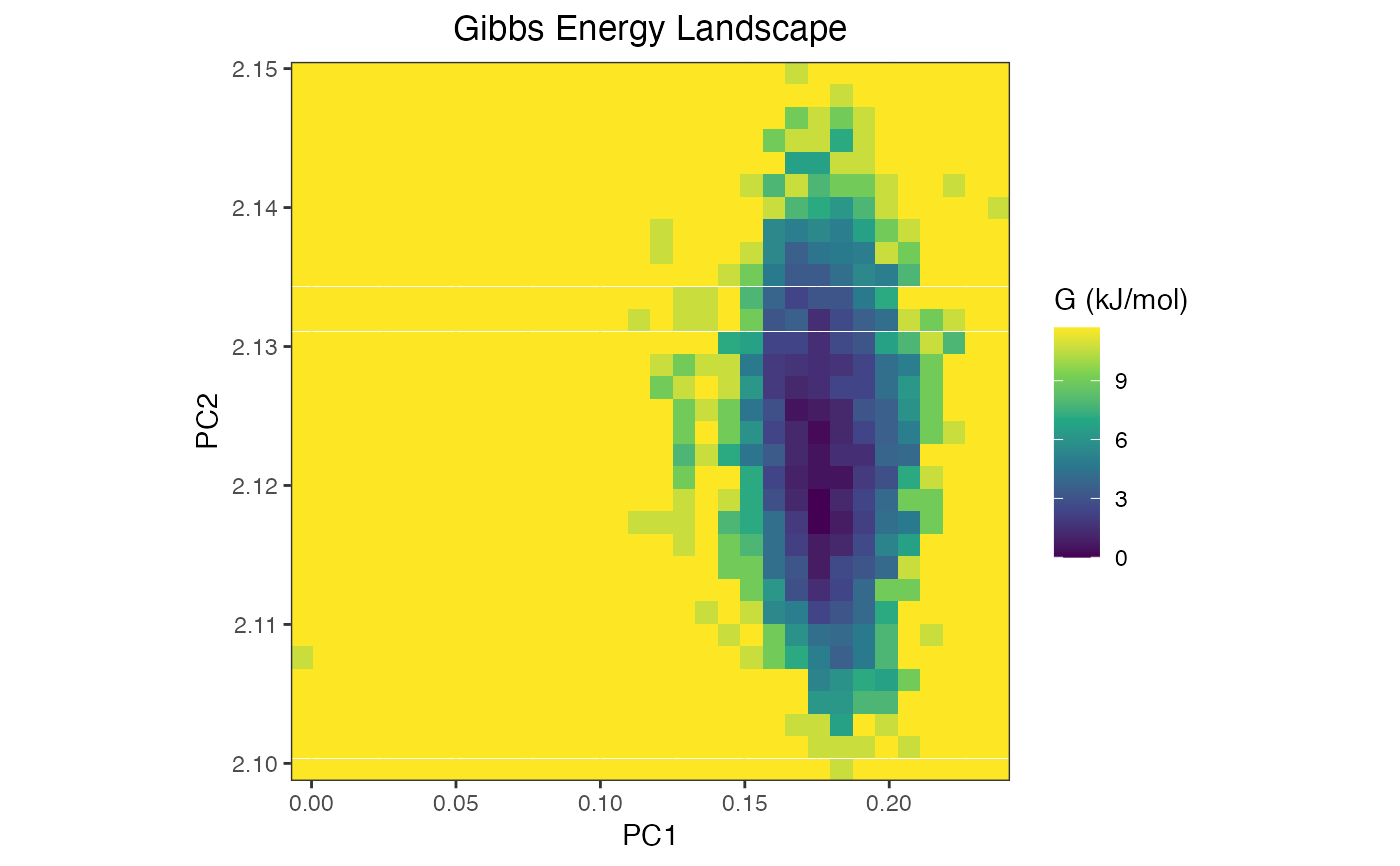
xpm_data <- read_xpm(xpm_file_path)
#> Dimensions parsed: width = 32, height = 32, colors = 50
plot_xpm(xpm_data) # plot the xpm data using plot_xpm() function
 # }
# }