creates dual-panel visualizations of xpm data with scatter or area plots.
Arguments
- xpm_data
a xpm object (from
read_xpm()) or list containing parsed objects.- plot_type
visualization type: "scatter" (default) or "area".
Value
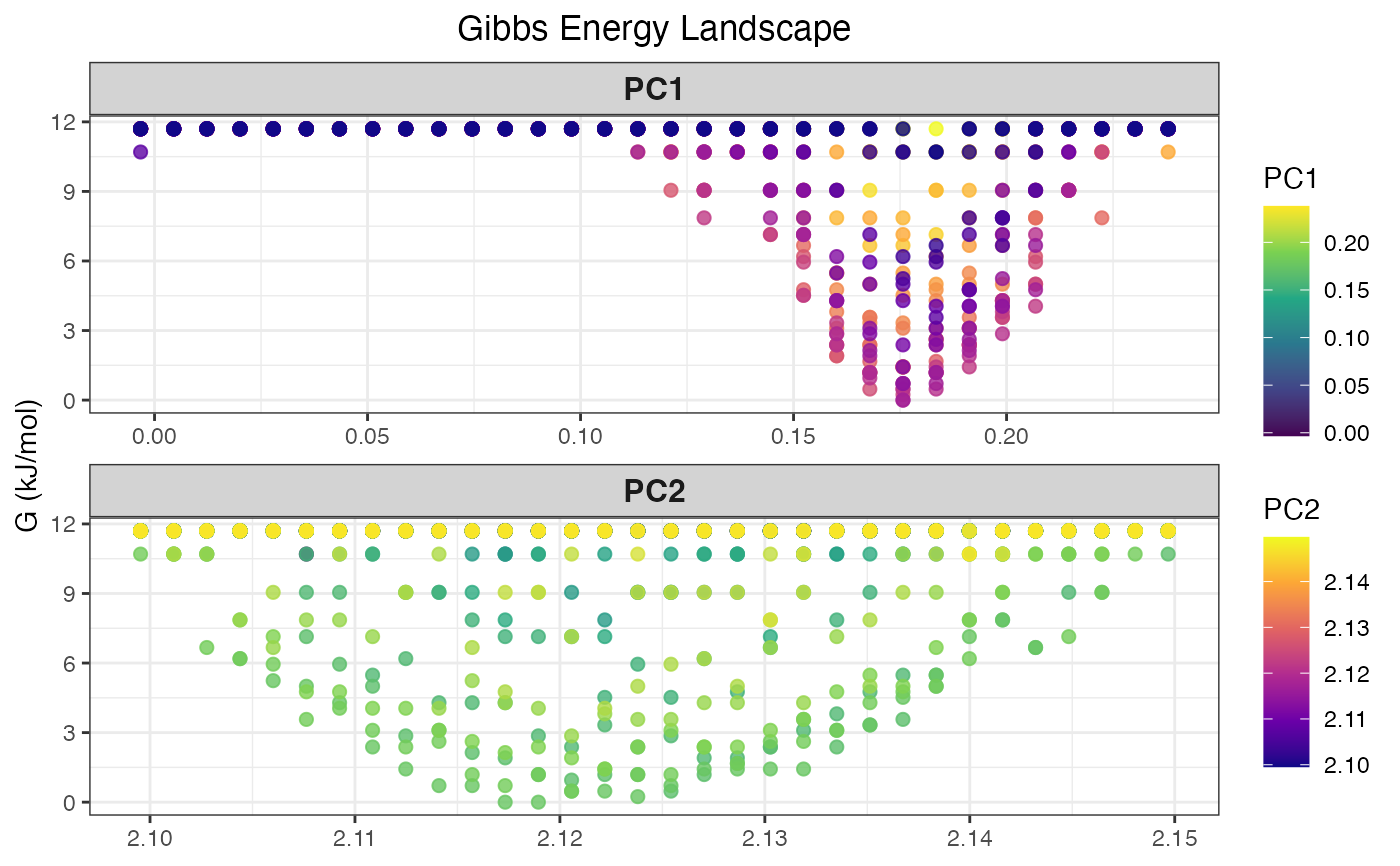
a ggplot2 object with:
Dual facets showing x/y axis relationships
Automatic data transformation for visualization
NULL if invalid plot_type specified
Examples
# \donttest{
library(xvm)
xpm_file_path <- system.file("extdata/gibbs.xpm", package = "xvm")
xpm_data <- read_xpm(xpm_file_path)
#> Dimensions parsed: width = 32, height = 32, colors = 50
plot_xpm_facet(xpm_data) # plot pseudo-3D from xpm file

# }
# }