plot xvg data using ggplot2
Usage
plot_xvg(
  xvg_data,
  merge = FALSE,
  title = NULL,
  subtitle = NULL,
  use_color_scale = NULL,
  ...
)
Arguments
- xvg_data
xvg data object returned by read_xvg
- merge
logical; if TRUE and multiple datasets provided, merge them (default: FALSE)
- title
chart title (default uses xvg file's title)
- subtitle
chart subtitle (default uses xvg file's subtitle)
- use_color_scale
custom color scale function (e.g., ggsci::scale_color_bmj) to override default colors
- ...
additional parameters passed to ggplot2::geom_line
Examples
# \donttest{
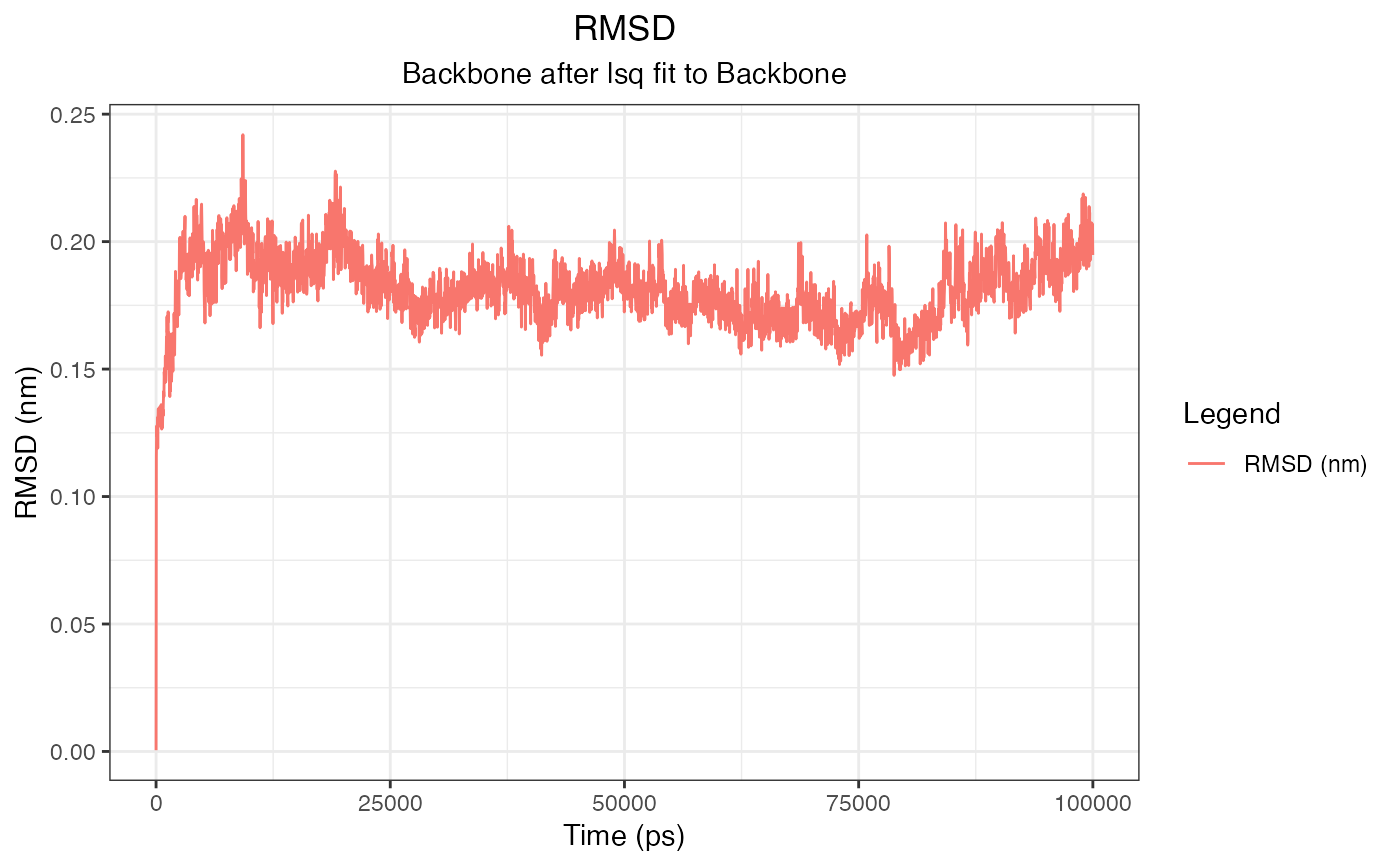
library(xvm)
rmsd_file_path <- system.file("extdata/rmsd.xvg", package = "xvm")
rmsd_data <- read_xvg(rmsd_file_path)
plot_xvg(rmsd_data) # plot the xvg data using plot_xvg() function
 # }
# }